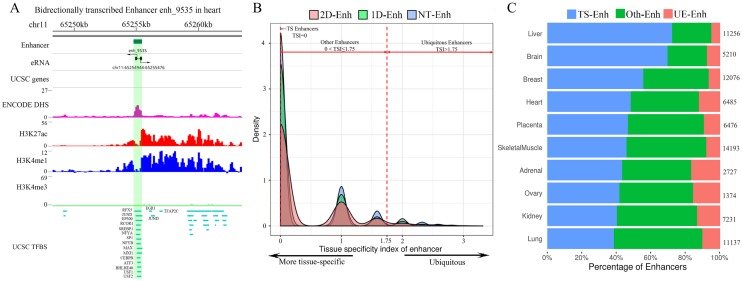
Fig 1.
Identification of TS-Enh, UE-Enh and Oth-Enh in 10 tissues. (A) An enhancer named enh_9535 in genome region chr11: 65,248,300-65,263,500 is visualized with the integrative genomics viewer (IGV). (B) The distribution of tissue specificity of the enhancers. With the smaller tissue specificity index, the enhancer is more specific. (C) The proportion and the number of TS-Enh, UE-Enh and Oth-Enh in 10 tissues.

