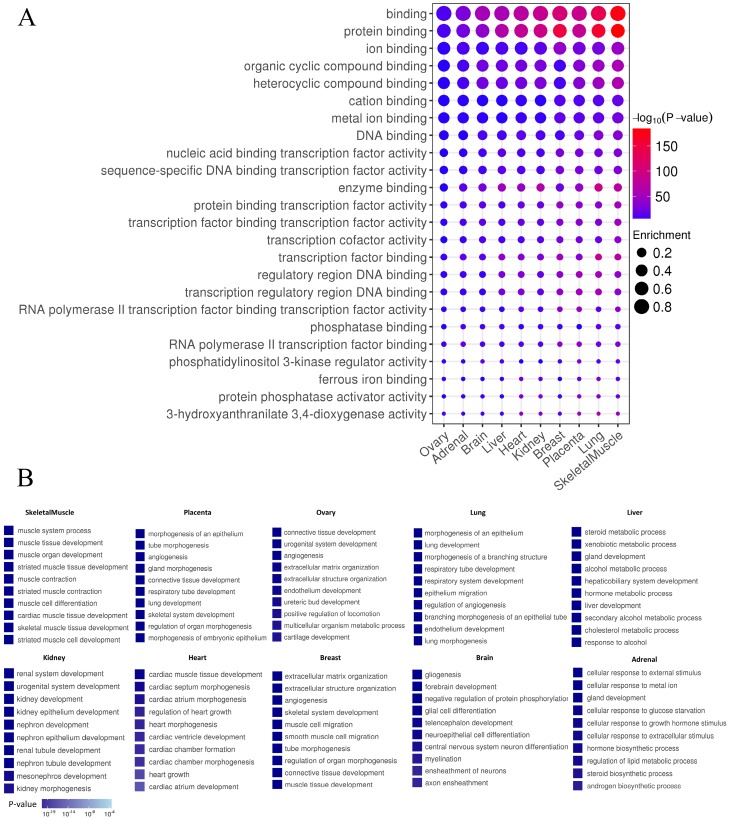
Fig 6.
Enhancer features and Gene Ontology (GO) analysis of target genes of TS-Enh in 10 tissues. (A) The greater dot size indicates the higher enrichment of enhancers in a functional term. (B) Gene Ontology (GO) analysis of TS-Enh target genes in each tissue. The top ten GO terms of the genes associated with TS-Enh function in each tissue are displayed.

