Fig 1.
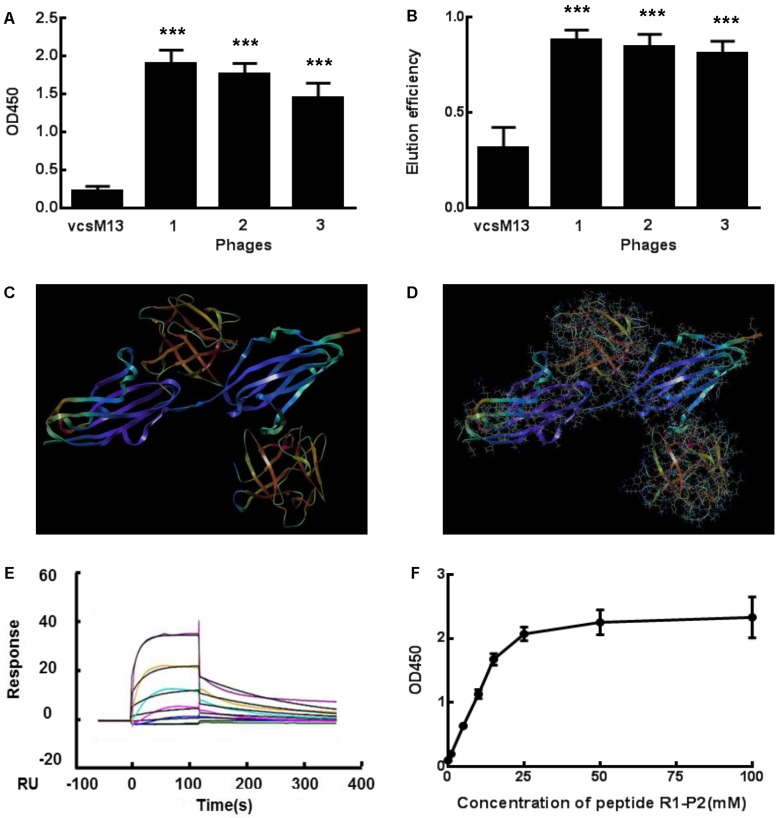
Specific binding of the positive phage clones and peptide to FGFR1. (A) The binding affinities to FGFR1 of three selected positive phage clones and the control vcsM13 were determined by ELISA assay. (B) Detection of FGF2 elution efficiency to the three selected positive phage clones. (C-D) Molecular docking of peptide R1-P2 binding to the extracellular region of FGFR1. C, The extracellular region of FGFR1 contain 211 amine acid (as blue), which have two sites binding to FGF ligand (as orange, named upper is A site, lower is B site ); D, Molecular docking of peptide R1-P2 binding to A and B site of FGFR1, respectively. (E) Affinity measured by Biacore X100. The affinity constant was calculated using the following formula: affinity constant (KD) = dissociation constant (Kd)/binding constant (Ka), which reflected the degree of antigen-antibody reaction; the smaller of the value, the stronger of its binding affinity. (F) Affinity detection of different concentration of peptide R1-P2 binding to FGFR1 by ELISA. The error bars indicate the ± SD from three separate experiments, ***P < 0.001,versus VCSM13.

