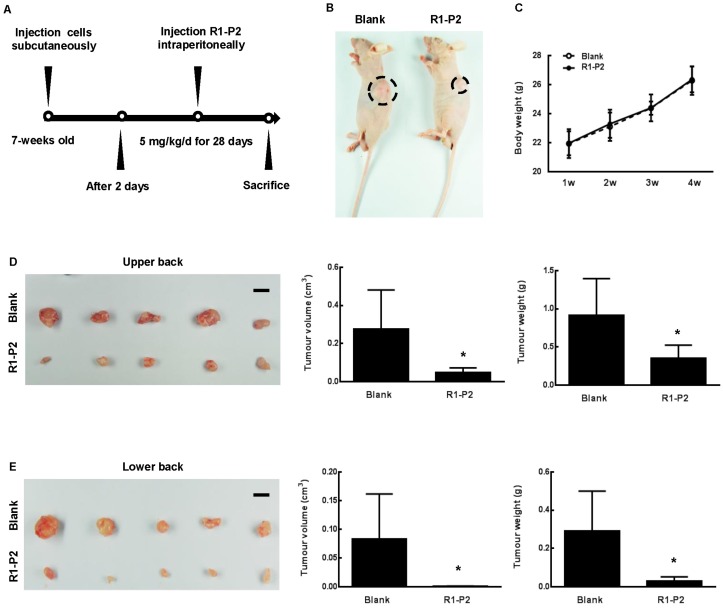
Fig 3.
Anti-tumor effects of peptide R1-P2 in A549 xenograft model. (A) Experimental schedule for xenograft experiment. (B) Representative images of tumor 30 days after cell injection (black dotted line marking neoplasm). (C) Body weight of each group was recorded weekly (n = 5). (D) Images of tumor from sacrificed nude mice from upper back, tumor volume (cm3) and tumor weight (g) were recorded (n = 5). (E) Images of tumor from lower back of sacrificed nude mice, tumor volume (cm3) and tumor weight (g) were recorded (n = 5). Bar = 1 cm, the error bars indicate the ± SD from five separate experiments, *P < 0.05, versus blank.

