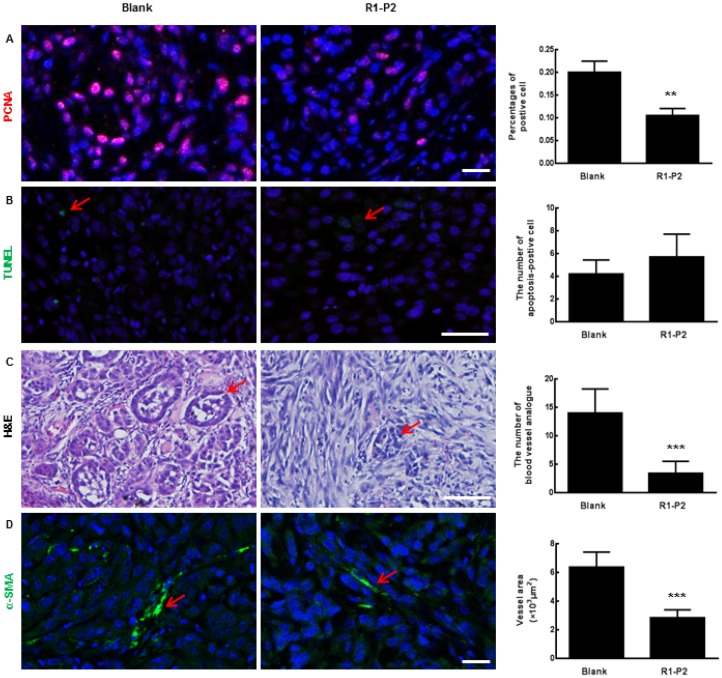
Fig 4.
Histological analysis of tumor sections. (A) The expression of PCNA in tumor sections were detected by immunofluorescence staining. (B) Apoptosis in tumor sections were detected by TUNEL (red arrows represents apoptosis cell). (C) Sections were stained with H & E (red arrows represents blood vessel analogue). (D) The expression of α-SMA in tumor sections were detected by immunofluorescence staining (red arrows represents blood vessels). Bar = 100 μm, the error bars indicate the ± SD from three separate experiments, **P < 0.01, ***P < 0.001, versus blank.

