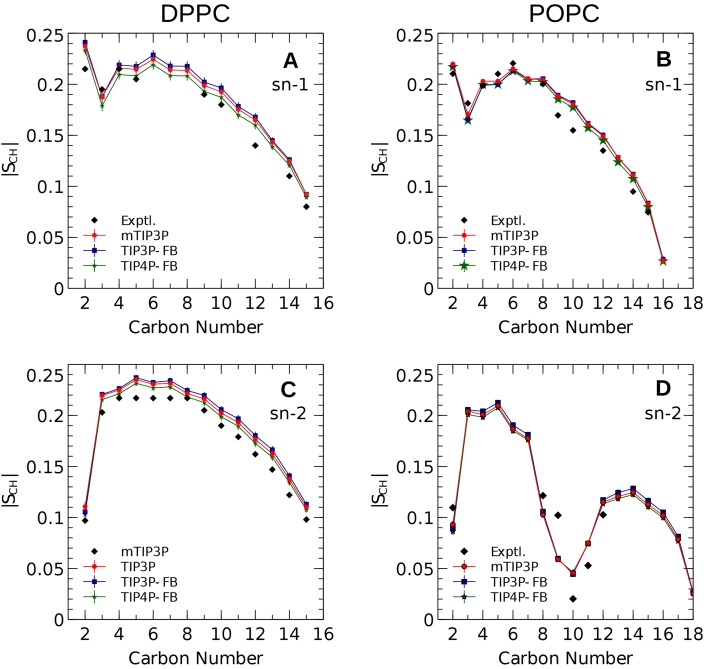
Figure 4. NMR deuterium order parameters (|SCD|) for the lipid tails of the DPPC and POPC bilayers calculated from simulations of the bilayers with the mTIP3P, TIP3P-FB, and TIP4P-FB water models.
(A) and (B) show the profile for the first chain (sn-1), while the (C) and (D) shows the second chain (sn-2). Experimental values are reproduced from Seelig & Seelig (1974), Seelig & Waespe-Sarcevic (1978), Douliez, Léonard & Dufourc (1995), Li et al. (2017). In most cases, the values from the simulations are so similar that the points lie on top of each other. The numbering of the positions on the acyl chains is illustrated in Fig. 2.

