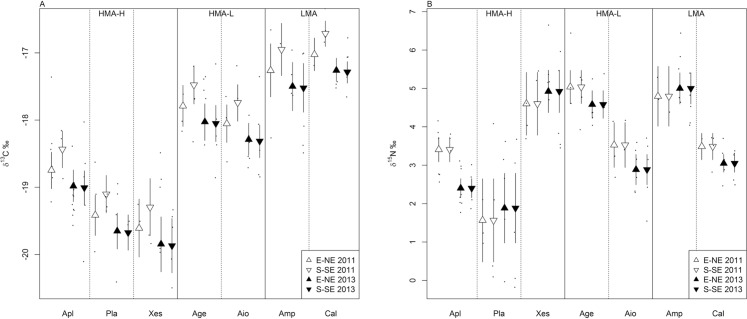
Figure 3. Variation in δ13C (A) and δ15N (B) of different sponge species along the S-SE and E-NE side of the Saba Bank in 2011 and 2013.
Means and 95% credible intervals are based on Bayesian statistics. Black dots represent the raw data of δ13C (A) and of δ15N (B), respectively, of the different sponge species. Sponges are grouped according to their functional traits (HMA-H, HMA-L and LMA). For sponge species abbreviations see Fig. 2.

