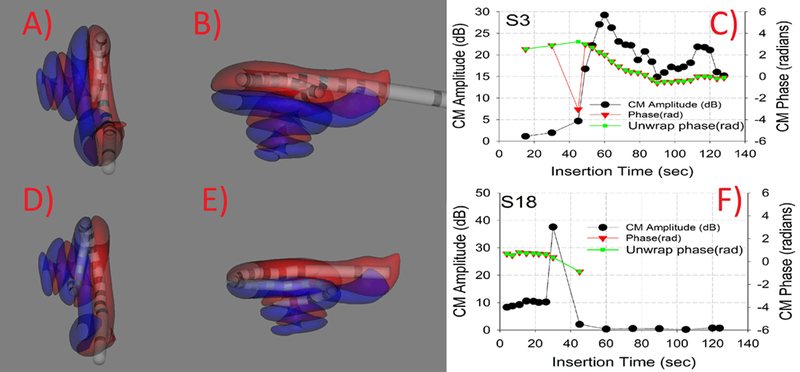
Figure 2:

Two representative insertions for each non-translocation and translocation. Panels A and B show two different views of a reconstructed CT image showing insertion completely in ST. Panel C shows the ECochG amplitude and phase changes during insertion. EcochG amplitudes show increase during insertion and minor decrease in amplitude during insertion. Panels D and E show two different views of reconstructed CT image showing electrode translocation from ST to SV. Panel F shows the ECochG amplitude and phase changes during insertion. ECochG amplitude shows an increase in amplitude followed by a dramatic drop and no recovery.
