
Figure-4.
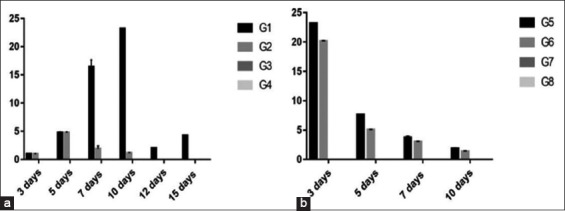
Column chart showing RNA copies of H9 using rRT-polymerase chain reaction in chicken groups and different time conditions. (a) Experiment 1, (b) Experiment 2.
Official websites use .gov
A
.gov website belongs to an official
government organization in the United States.
Secure .gov websites use HTTPS
A lock (
) or https:// means you've safely
connected to the .gov website. Share sensitive
information only on official, secure websites.
Column chart showing RNA copies of H9 using rRT-polymerase chain reaction in chicken groups and different time conditions. (a) Experiment 1, (b) Experiment 2.