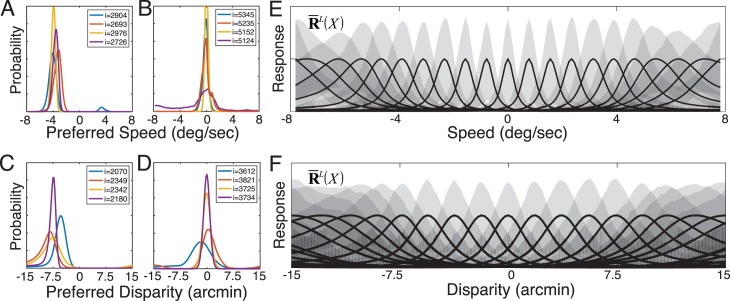
Figure 10.
Likelihood functions for speed and disparity tasks. (A) Likelihood functions for four randomly chosen natural image movies having true speeds of 4°/s. Each likelihood function represents the population response of the set of likelihood neurons, arranged by their preferred speeds. To ease the visual comparison, the likelihood functions are normalized to a constant volume by the sum of the likelihoods. (B) Same as (A), but for movies with a true speed of 0°/s. (C, D) Same as (A, B) but for stereo-images with −7.5 arcmin and 0.0 arcmin of disparity, respectively. (E) Tuning curves of speed-tuned likelihood neurons. For speeds sufficiently different from zero, tuning curves are approximately log-Gaussian and increase in width with speed. For near-zero speeds, tuning curves are approximately Gaussian. Each curve represents the mean response (i.e., tuning curve) of a likelihood neuron having a different preferred speed, normalized to a common maximum. Gray areas indicate 68% confidence intervals. (F) Tuning curves of disparity-tuned likelihood neurons.

