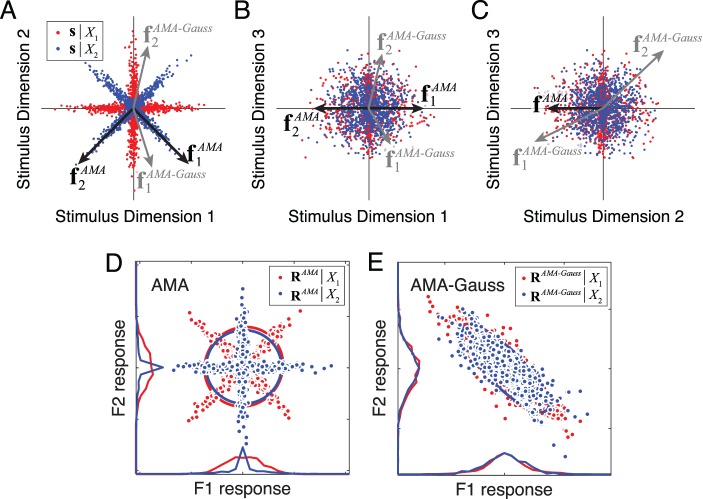
Figure A1.
AMA vs. AMA–Gauss with simulated non-Gaussian class-conditional stimulus distributions. (A–C) Simulated stimuli from category 1 (red) and category 2 (blue). Each subplot plots two of the three stimulus dimensions against each other. All of the information for discriminating the categories is in the first two stimulus dimensions. AMA filters (black) and AMA–Gauss (gray) filters (which have the same dimensionality as the stimuli) are represented by arrows. AMA filters place all weight in the first two informative stimulus dimensions; that is, the two-dimensional subspace defined by the two AMA filters coincides with the most informative stimulus dimensions. AMA–Gauss filter weights are placed randomly across the three stimulus dimensions; that is, the two-dimensional subspace defined by the two AMA-Gauss filters will be random with respect to the most informative subspace. (D) Class-conditional AMA filter responses RAMA allow the categories to be discriminated. (E) Class-conditional AMA–Gauss filter responses RAMA–Gauss do not allow the categories to be discriminated.

