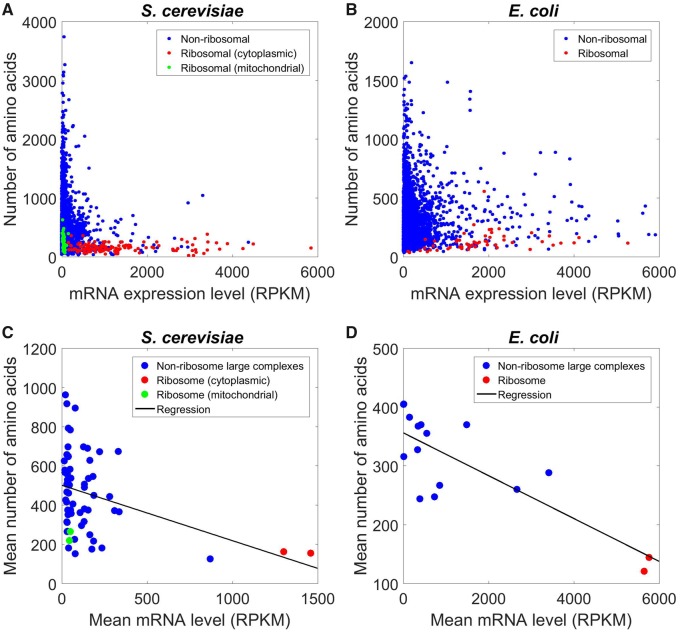
Fig. 2.
—Protein length tends to decline with its mRNA expression level. (A) Relationship between protein length and mRNA expression level in yeast. Each dot represents one protein. Red and green colors indicate cytoplasmic and mitochondrial r-proteins, respectively. (B) Relationship between protein length and mRNA level in Escherichia coli. Red color indicates r-proteins. (C) Relationship between mean protein length and mean mRNA level of members of large protein complexes in yeast. Each dot represents one complex. The two red dots indicate the two subunits of the cytoplasmic ribosome, whereas the two green dots indicate the two subunits of the mitochondrial ribosome. The black line shows the linear regression. (D) Relationship between the mean protein length and mean mRNA level of large protein complexes in E. coli. The two red dots indicate the two subunits of the ribosome.

