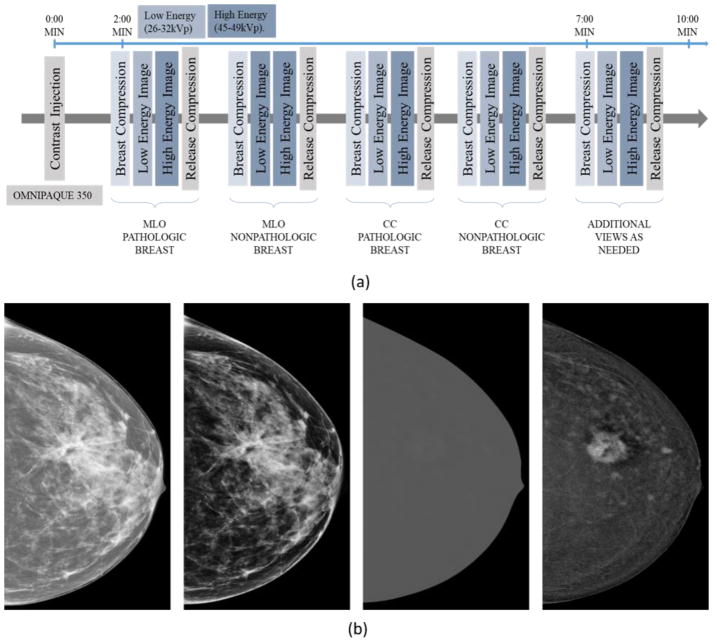
Figure 1.
(a) Illustration of the workflow of a CEDM imaging acquisition procedure and (b) an example of 4 images from left to right: High energy (HE) image, Low energy (LE) image, dual energy subtraction (DES) image displayed at same window and level as HE image, and the DES image displayed at an adjusted window and level for improving visibility, respectively.

