
Figure 3. Recognition of TRF1 by Fbx4.
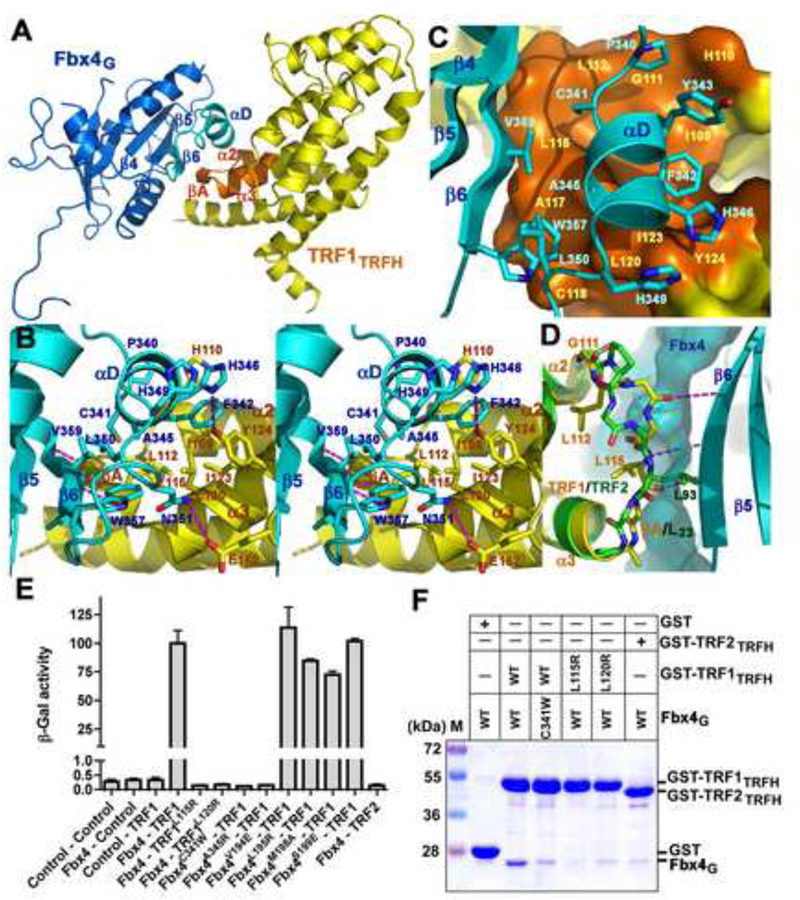
(A) An overall view of the Fbx4G-TRF1TRFH interaction. The interacting structural elements of Fbx4G (β6 and αD) and TRF1TRFH (βA, α2 and α3) are colored in cyan and orange, respectively, and the rest of Fbx4G and TRF1TRFH in blue and yellow.
(B) Stereo view of the Fbx4G-TRF1TRFH interface. Fbx4G and TRF1TRFH interacting residues are presented as stick models. The Fbx4G-TRF1TRFH intermolecular hydrogen bonds are shown as dashed magenta lines.
(C) The αD helix of Fbx4G sits on a hydrophobic surface formed by μA and helices of α2 and α3 of TRF1TRFH.
(D) Fbx4G binding is TRF1TRFH specific. Loop L23 of TRF2TRFH (green) adopts a different conformation than that of TRF1TRFH (yellow) so that it cannot form an intermolecular β-sheet interaction with Fbx4G. The surface representation shows that the side chain of TRF2 Leu93 collides with μ6 of Fbx4G.
(E) Effects of the Fbx4 and TRF1 mutations on the Fbx4-TRF1 interaction in a yeast two-hybrid assay. Interaction of LexA-TRF1 with GAD-Fbx4 was measured as β-galactosidase activity. Data are average of three independent β-galactosidase measurements normalized to the wild-type Fbx4-TRF1 interaction, arbitrarily set to 100. Error bars in the graph represent standard deviation.
(F) GST pull-down assay of the wild-type and mutant Fbx4G-TRF1TRFH interactions.