
Figure 2.
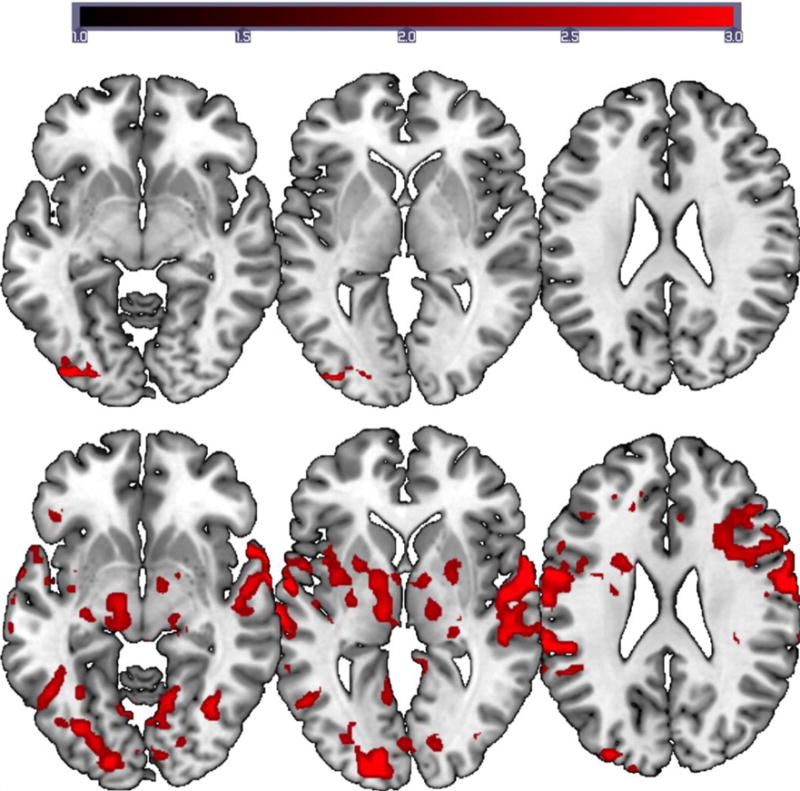
Group activation maps for the reading (top) and naming tasks (bottom) for the normal controls. FMRI data registered in MNI space shows areas of activation associated with word reading compared to viewing checkerboards and correct picture naming (phonemic+word cued naming) compared to viewing scrambled pictures. Images are displayed on MNI brain using MRIcroGL. Z (Gaussianised T/F) statistic images were thresholded using clusters determined by Z > 2.3 and a (corrected) cluster significance threshold of p = 0.05. All images are shown in neurological convention (left in image is left in the brain). The scale on the intensity bar represents the Z scores.