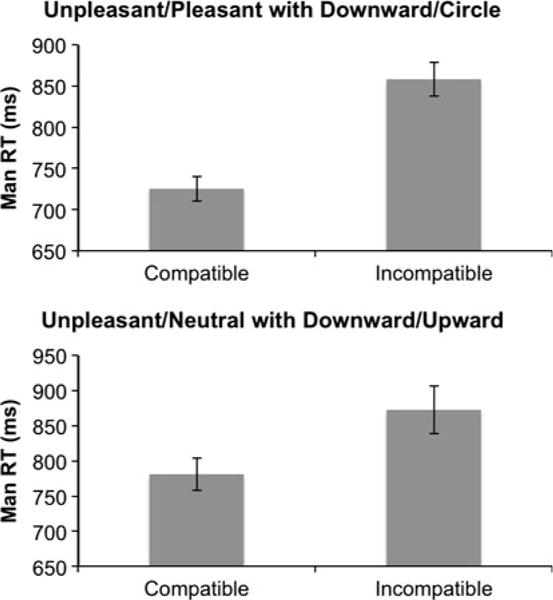
Fig. 2.

Mean RT for compatible and incompatible blocks for Experiment 1a (top panel) and Experiment 1b (bottom panel). For Experiment 1a compatible trials included unpleasant/downward and pleasant/circle, and incompatible trials paired unpleasant/circle and pleasant/downward. For Experiment 1b the compatible trials paired unpleasant/downward and neutral/upward and the incompatible trials paired unpleasant/upward and neutral/downward. Error bars represent standard error. Please not that the scale for the y-axes is different for the two graphs
