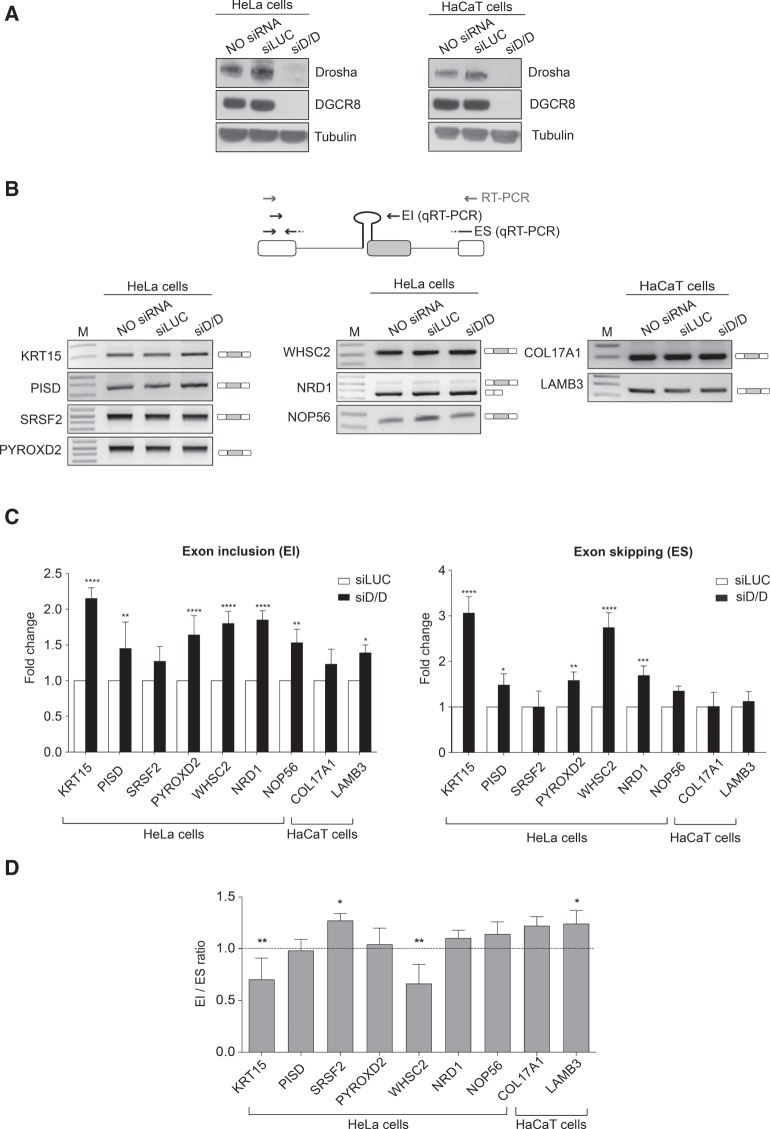
FIGURE 1.
Microprocessor complex depletion does not increase the splicing ratio of the SO-miRNA exons. (A) Western blot analysis of Drosha, DGCR8, and Tubulin proteins from untreated (NO siRNA), control treated (siLUC), and Drosha/DGCR8-depleted (siD/D) HeLa and HaCaT cells. (B) Schematic representation of a SO-miRNA transcript. Boxes represent exons and lines introns. The SO-miRNA exon is highlighted in gray. Gray arrows indicate primers used for endpoint PCR. Black arrows represent the primer sets used for quantitative analysis of exon inclusion (EI) and exon skipping (ES) splice isoforms. RT-PCR analysis of SO-miRNA transcripts in untreated, siLUC-treated, and Drosha/DGCR8-depleted cells. Band identity is depicted on the right. M, marker. (C) qRT-PCR analysis of EI and ES splice isoforms abundance in siD/D-treated HeLa and HaCaT cells, relative to siLUC-treated cells. Two different primer sets are shown in panel B (black arrows). Graphs show fold changes in the EI (left panel) and ES (right panel) splice isoforms levels, relative to siLUC-treated cells set to one. Data were normalized to GAPDH for HeLa cells and for the geometric mean of TBP, RPLPO, and RLFP13A genes for HaCaT cells. Error bars show SD (three independent experiments). P-values were calculated using two-way ANOVA test. (*) P < 0.05; (**) P < 0.01; (***) P < 0.001; (****) P < 0.0001. (D) Graph showing expression ratio of splice isoforms analyzed in panel C. Error bars show SD (three independent experiments). P-values were calculated using two-way ANOVA test. (*) P < 0.05; (**) P < 0.01.

