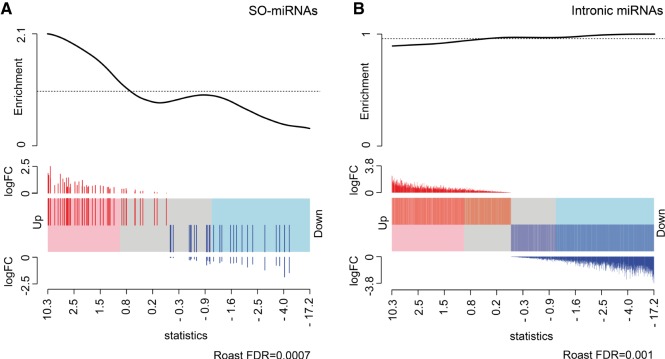
FIGURE 2.
SF3b1 silencing increases the expression level of SO-miRNAs and slightly decreases the production of intronic miRNAs. (A,B) Gene set analysis computed by the ROAST method compares differential expression of SO-miRNAs (A) and intronic miRNAs (B) in the SF3b1-depleted and control-treated MEC-1 cells. Barcode plot shows each miRNA ranked by the empirical Bayes moderated t-statistics and horizontally represented by bars in a shaded rectangle. miRNAs up-regulated upon SF3b1 depletion are shaded pink and down-regulated ones are blue. The log2FC of each miRNA is indicated above and below the barcode as red and blue lines. (A) Gene set analysis on 52 SO-miRNAs. Barcode plot shows a relevant enrichment of up-regulated SO-miRNAs with a statistically significant FDR (<0.001). (B) Gene set analysis on intronic miRNAs. Barcode plot shows a small enrichment of down-regulated intronic miRNAs with a significant FDR (0.001).

