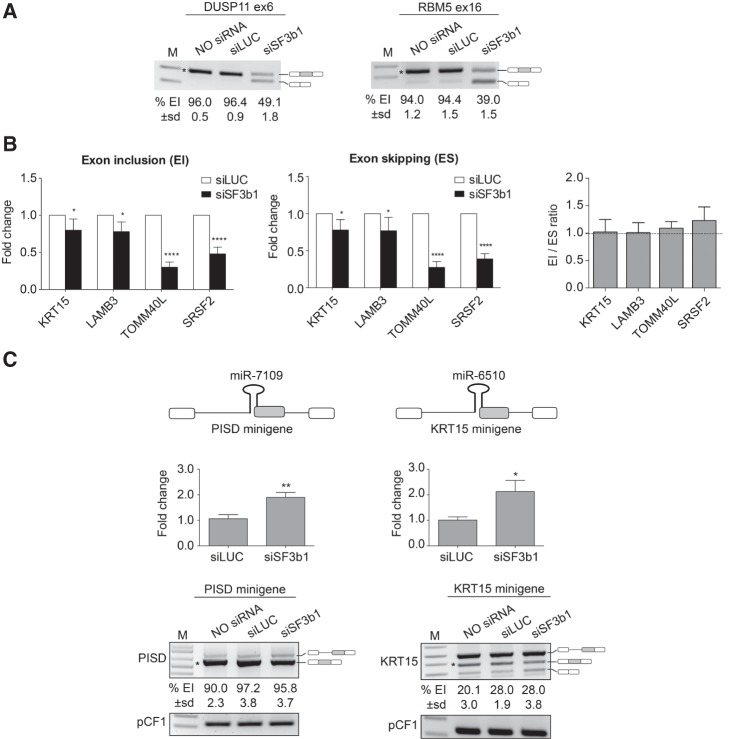
FIGURE 3.
SF3b1 silencing increases the production of SO-miRNAs without affecting the splicing pattern of the corresponding exons. (A) RT-PCR analysis of DUSP11 and RBM5 mRNAs in untreated, siLUC-treated, and SF3b1-depleted MEC-1 cells. Alternative splicing events are indicated on the right. Numbers below each line indicate percentage of EI quantified by ImageJ and expressed as mean ± SD of three independent experiments. (*) indicates the specific quantified isoform. M, marker. (B) qRT-PCR analysis of exon inclusion (EI) and exon skipping (ES) splice isoforms abundance in SF3b1-depleted MEC-1 cells, relative to siLUC-treated cells. Graphs show fold changes in the EI (left panel) and ES (middle panel) splice isoforms levels, relative to siLUC-treated cells set to one. Data were normalized to GAPDH gene. Error bars show SD (three independent experiments). P-values were calculated using two-way ANOVA test. (*) P < 0.05; (****) P < 0.0001. Right panel shows expression ratio of EI and ES isoforms. Error bars show SD (three independent experiments). No significant differences were observed by two-way ANOVA test. (C) Schematic representation of the PISD and KRT15 minigene systems, containing the pri-miR-7109 and pri-miR-6510 (black hairpins) along with their flanking genomic regions. SO-miRNA exons are highlighted in gray. miR-7109 and miR-6510 expression by TaqMan qRT-PCR in siLUC-treated and SF3b1-depleted cells. Expression fold change values are depicted relative to siLUC-treated cells set to one. Data were normalized to RNU6B. Error bars show SD of three independent experiments. P-values were calculated using unpaired t-test. (*) P < 0.05; (**) P < 0.01. Splicing pattern of PISD and KRT15 minigenes transiently transfected in untreated, siLUC-treated, and SF3b1-depleted cells. The identity of the band is depicted on the right. Numbers below each line indicate the percentage of EI quantified by imageJ and expressed as mean ± SD of three independent experiments. (*) indicates the specific quantified isoform. pCF1 plasmid was used as control for normalization of transfection and reverse transcriptase efficiencies. M, marker.

