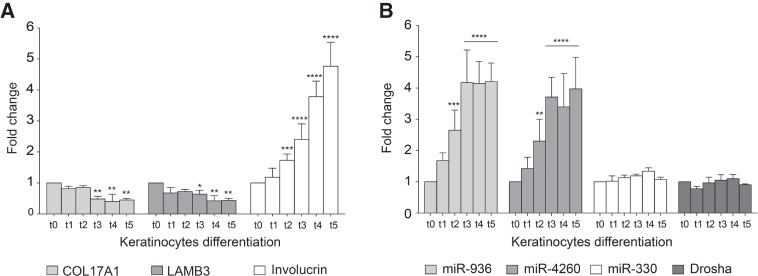
FIGURE 4.
mRNAs’ and SO-miRNAs’ expression level during keratinocytes differentiation. qRT-PCR analysis of (A) COL17A1, LAMB3, and involucrin (used as keratinocyte differentiation marker) transcripts, and (B) miR-936, miR-4260, miR-330 expression by TaqMan assay and Drosha transcript abundance in proliferating keratinocytes (t0) and calcium-treated differentiated cells (t1 to t5). Graphs show expression fold changes in t1–t5 cells, relative to t0 cells set to one. Data were normalized against the geometric mean of TBP, RPLP0, and RPL13A genes. Error bars represent SD between three independent calcium-induced differentiation experiments. P-values were calculated using two-way ANOVA test. (*) P < 0.05; (**) P < 0.01; (***) P < 0.001; (****) P < 0.0001.

