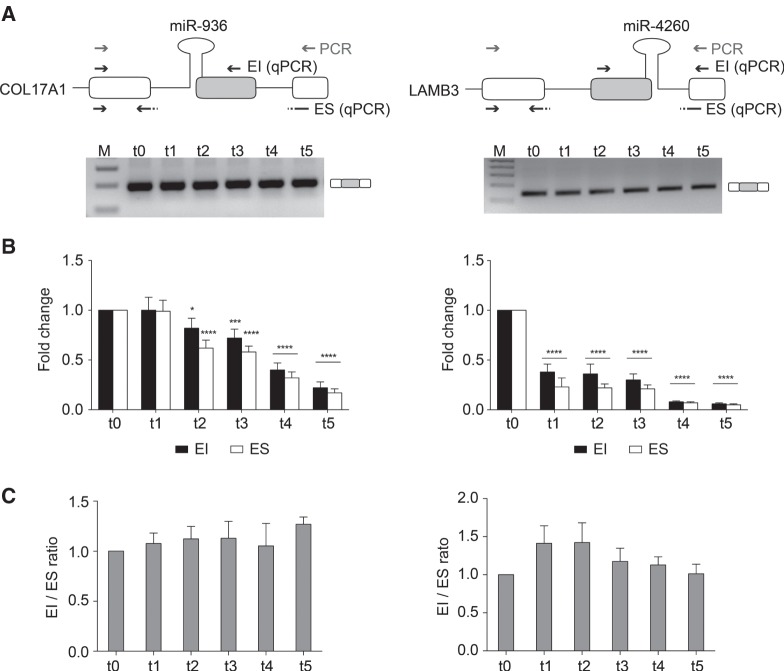
FIGURE 5.
Keratinocyte differentiation does not affect alternative splicing of COL17A1 and LAMB3 exons. (A) Schematic representation of the genomic regions surrounding the COL17A1 and LAMB3 SO-miRNA exons. SO-miRNA exons are gray boxes, flanking exons are white boxes and the pri-miRNA hairpins, located across the intron-exon junction, are indicated. Gray arrows indicate primers used for endpoint RT-PCR. Black arrows represent the primer sets used for quantitative analysis of exon inclusion (EI) and exon skipping (ES) splice isoforms. Endpoint RT-PCR of COL17A1 and LAMB3 transcripts in proliferating keratinocytes (t0) and calcium-treated differentiated cells (t1 to t5). Band identity is depicted on the right. M, marker. (B) qRT-PCR analysis of EI and ES splice isoforms abundance in proliferating keratinocytes (t0) and calcium-treated differentiated cells (t1 to t5). Two different primer sets are shown in panel A (black arrows). Graphs show fold changes in the EI (black columns) and ES (white columns) splice isoforms levels, relative to t0 keratinocytes, set to one. Data were normalized to the geometric mean of TBP, RPLPO, and RLFP13A genes. Error bars show SD (three independent experiments). P-values were calculated using two-way ANOVA test. (*) P < 0.05; (**) P < 0.01; (***) P < 0.001; (****) P < 0.0001. (C) Graph showing expression ratio of splice isoforms analyzed in panel B. Error bars show SD (three independent calcium-induced differentiation experiments). No significant differences across the different time points of differentiation were observed by one-way ANOVA test.

