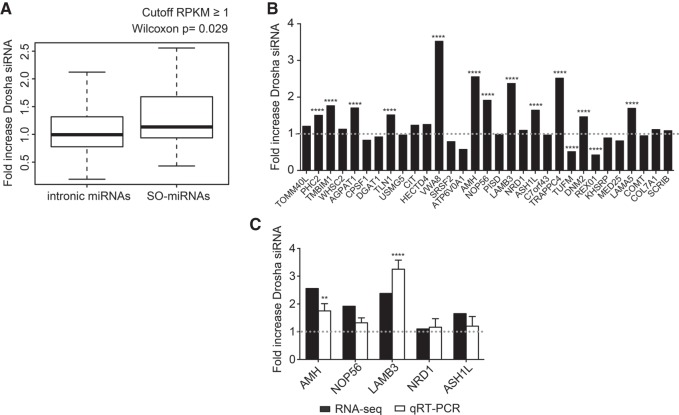
FIGURE 6.
Effect of Drosha siRNA effect on intronic and SO-miRNA-containing transcripts. Chromatin RNA-seq analysis. (A) Box plot showing fold increase of Drosha distribution in the intronic miRNAs and SO-miRNAs expressed in HeLa cells with a gene body RPKM ≥ 1. The P-value calculated with a two-sided Mann-Whitney-Wilcoxon test is indicated above. (B) List of the 31 SO-miRNA-hosting transcripts expressed in HeLa cells with a gene body RPKM ≥ 1. Graph showing fold increase of normalized read counts of Drosha siRNA-treated cells relative to control siRNA-treated cells were plotted in the graph. P-values were calculated using two-way ANOVA test. (****) P < 0.0001. Dotted line is set to one. (C) Fold increase of normalized reads counts of Drosha siRNA relative to control siRNA-treated HeLa cells detected by chromatin RNA-seq of five selected SO-miRNA transcripts from panel B were plotted in the graph (black columns) and compared to qRT-PCR data obtained from the analysis of the nascent transcripts in the RNA isolated from nuclear chromatin of Drosha siRNA and control siRNA-treated HeLa cells (white columns). Dotted line is set to one. qRT-PCR data are normalized to GAPDH. Error bars represent standard deviations between three independent validation experiments. P-values were calculated using two-way ANOVA test. (**) P < 0.01; (****) P < 0.0001.

