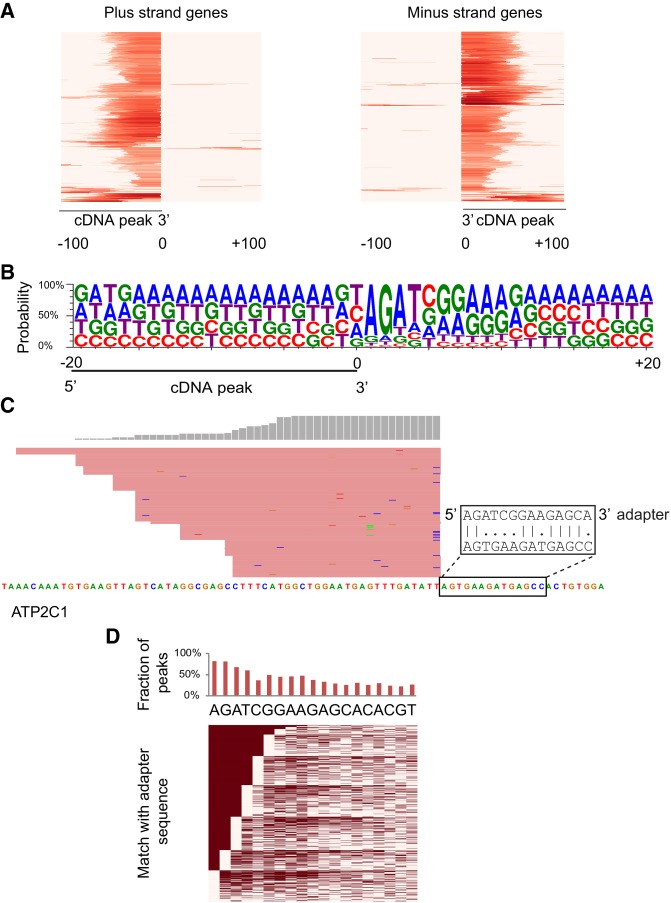
FIGURE 2.
Characteristics of EZH2 enriched cDNA peaks from short RNA-seq. (A) Heatmap showing EZH2-enriched cDNA peaks with flush ends. The heatmap shows the distribution of reads spanning 200 bases around EZH2-enriched peaks. The intensity of red color represents mapped read counts. Each row represents an EZH2-enriched cDNA peak. (B) Sequence logo showing sequence enrichment spanning 40 bp around an EZH2-enriched cDNA peak with its 3′ end at position 0. (C) A cDNA peak adjacent to a sequence with its first two bases matching the 3′ adapter followed by scattered matches. (D) Sequence matches between bases adjacent to the 3′ end of all EZH2-enriched cDNA peaks and the sequence of the 3′ adapter (showing up to 19 bases). (Top) Overall proportion of peaks showing a match at each position. (Bottom) Heatmap of individual matches. Filled cells represent a match and empty cells correspond to positions that do not match the 3′ adapter. Rows are ordered by the number of matches starting from the left, which corresponds to the 3′ end of the adapter.

