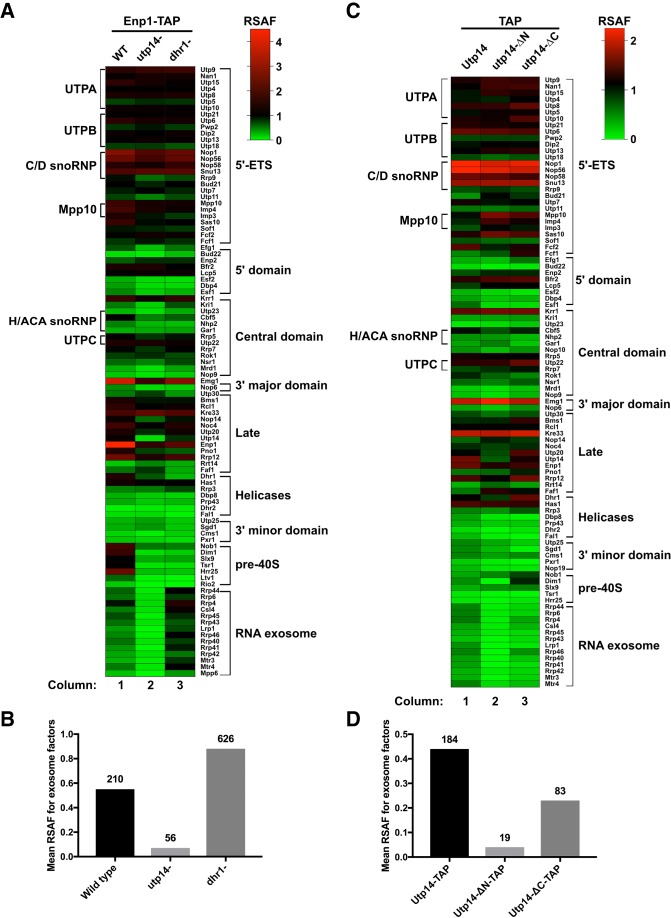
FIGURE 5.
Proteomic profiles of mutant Utp14 particles. (A) A heatmap representing the RSAF of each assembly factor identified by mass spectrometry relative to the mean RSAF of the UTP-B subcomplex of each sample for the affinity-purifications of wild-type, Utp14-depleted, or Dhr1-depleted particles purified via Enp1-TAP. (B) A histogram comparing the mean RSAF values (normalized to UTP-B) for the exosome for wild-type, Utp14-depleted, or Dhr1-depleted particles purified via Enp1-TAP. The total sum of spectral counts for the exosome factors in each sample is listed above each bar. (C) A heatmap and (D) a histogram representing data processed in the same manner as A and B, respectively, but particles purified via TAP-tagged WT or truncated Utp14. Coloring for the heatmaps reflects apparent stoichiometry of each factor: green, RSAF values less than one; black, RSAF value of approximately one; and red, RSAF of approximately two or greater. Proteins are grouped according to their order of recruitment to the preribosome as reported in Zhang et al. (2016) or by function. Heatmaps were generated in Graphpad Prism version 7.0c.169 for Mac iOS (www.graphpad.com). Complete data for this figure are provided in Supplemental File 2.

