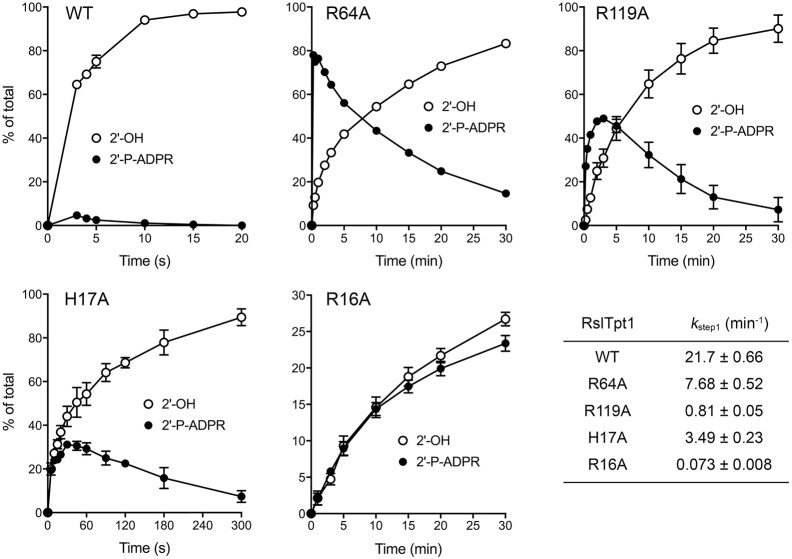
FIGURE 7.
Step-specific effects of mutations on the kinetics of 2′-PO4 removal. Assays were performed as described in the legend to Figure 6. The reaction products were analyzed by urea-PAGE and quantified by scanning the gels. The distributions of the 2′-P-ADPR RNA intermediate and 2′-OH RNA product (expressed as percentage of total RNA) are plotted as a function of reaction time. Each datum in the graphs is the average of three independent time course experiments ±SEM. The apparent rate constants for step1 shown in the table at bottom right were derived by plotting the sum of the 2′-P-ADPR RNA intermediate and 2′-OH RNA product as a function of time and fitting the data by nonlinear regression to a one-phase association in Prism.

