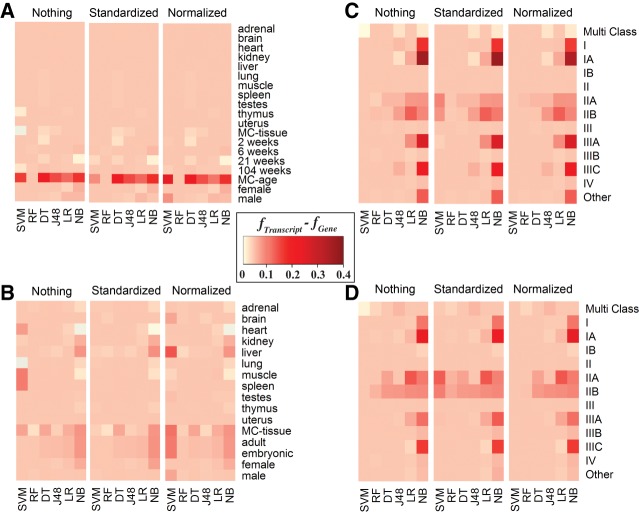
FIGURE 3.
Heat map representation of the difference between Isoform and Gene f-measure across machine learning methods, classes, data sets, and normalization techniques. For the majority of classification tasks, using isoform-level rather than gene-level expression data resulted in a small to substantial increase of the performance accuracy, represented by f-measure values here. The bottom x-axis represents the machine learning techniques ([DT] Decision Table, [J48] J48 Decision Tree, [LR] Linear Regression, [NB] Naïve Bayes, [RF] Random Forest, [SVM] Support Vector Machine). The y-axis represents the classes considered. MC stands for multiclass. The top x-axis represents normalization techniques including Nothing (no normalization), Standardized, and Normalized. Data sets for each panel are (A) RBM, (B) NCBI, (C) TCGA–log2 normalized counts, and (D) TCGA–raw counts.

