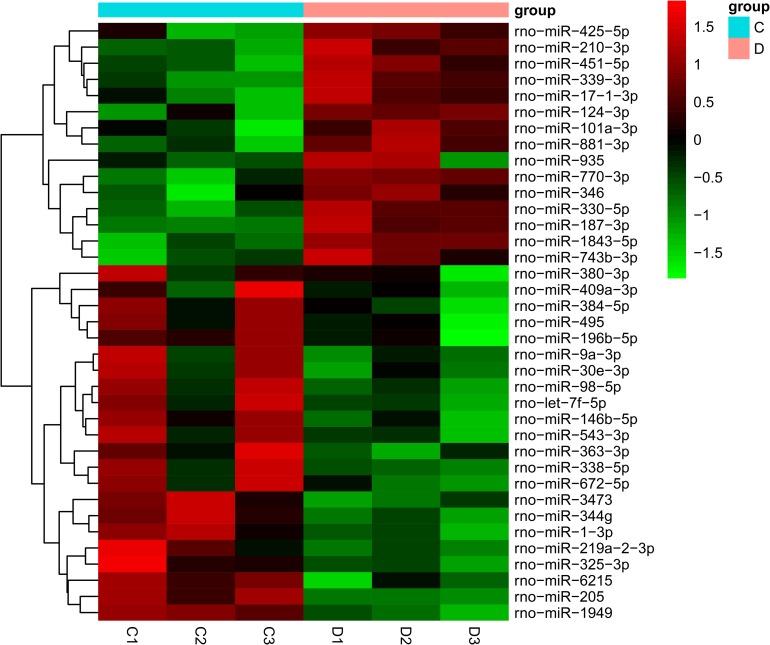
Fig 2. The heat map of aberrantly expressed miRNAs in diabetic rats.
A total of 37 significantly deregulated miRNAs were shown in the heat map, with 15 genes up-regulated and 22 down-regulated (n = 3 for diabetic rats and n = 3 for control rats). Red signals and green signals represent upregulated expression and downregulated expression, respectively. C: control rats; D: diabetic rats.

