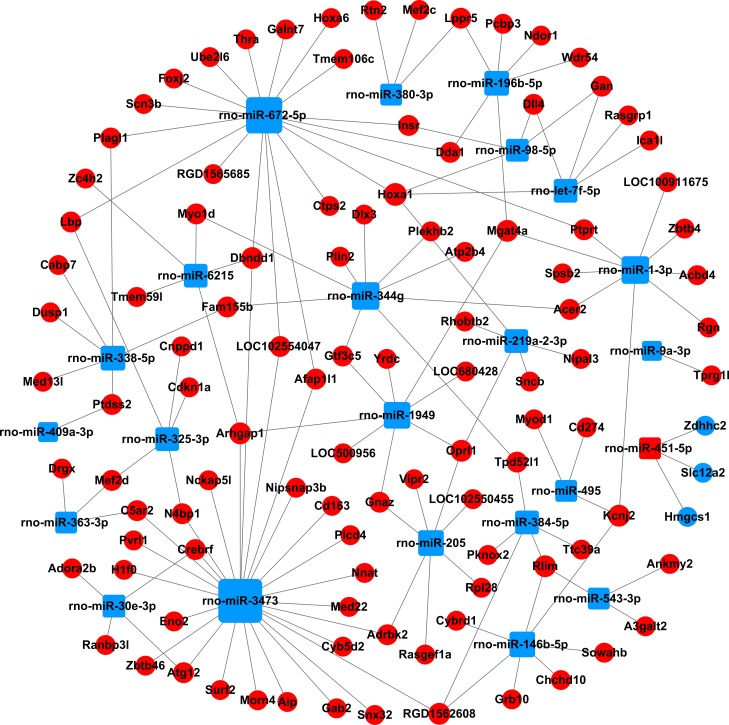
Fig 5. The miRNA-gene-network based on the downregulated miRNAs and their target mRNAs.
Square nodes and circular nodes represent miRNAs and mRNAs, respectively. Red color and blue color indicate upregulation and downregulation, respectively. A larger size of a node indicates a higher degree of connectivity.

