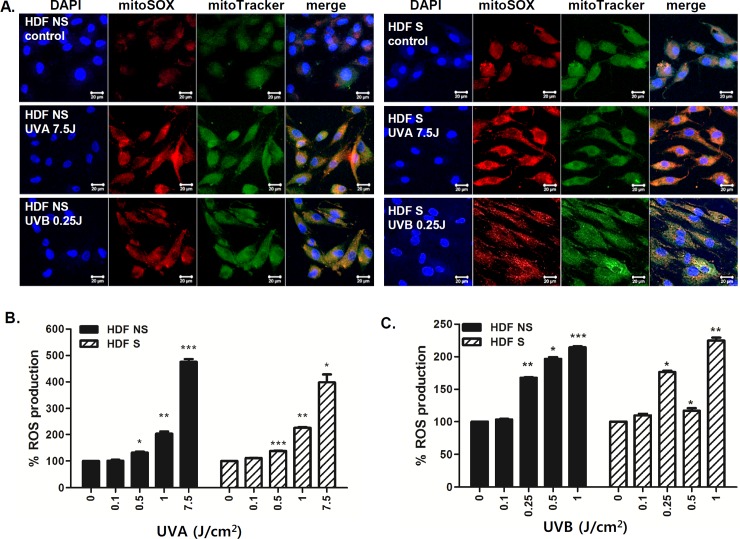
Fig 2. The effect of UV irradiation on ROS production in NS and S HDFs.
NS and S HDFs were irradiated with UVA (7.5 J/cm2) or UVB (0.25 J/cm2) for 2 h. (A) Cells were double-stained with DAPI (blue) and MitoSOX (red) or MitoTracker (green) and examined by confocal microscopy. Images are representative of three independent experiments; scale bar = 20 μm. (B,C) Cells were irradiated with various doses of UVA or UVB for 24 h. Total cellular ROS levels were determined by measuring DCF-DA levels using a spectrofluorometer. Percentage of ROS production in response to UVA (B) and UVB (C) is shown in the graphs. Data are presented as percentage normalized to the control (DMSO-treated cells). *p < 0.05; **p < 0.01; ***p < 0.001 vs. control cells.

