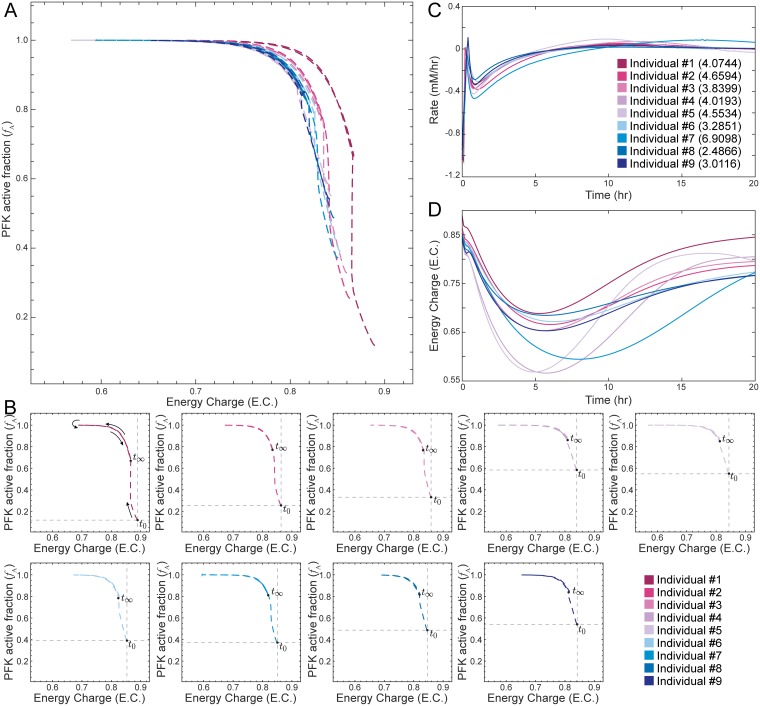
Fig 3. Disturbance rejection capabilities of personalized glycolytic models with an enzyme module for PFK and hemoglobin.
(A) Superimposed catalytic potential plots for all personalized models. (B) Catalytic potential plots for each individual; the intersection of the gray lines denotes the initial steady-state value at time zero and helps show the differences among the population. (C) The net rate of ATP usage (i.e., total flux through ATP-producing reactions minus total flux through ATP-consuming reactions) is shown as a function of time. The number in parentheses represents the SSE for each model, quantifying the total deviation of the output from the setpoint. (D) The energy charge is shown as a function of time.

