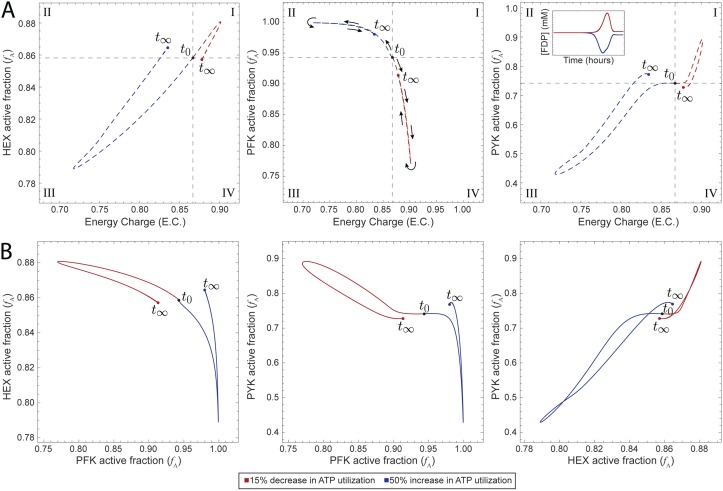
Fig 4. Dynamic responses of the base model with all three enzyme modules to perturbations in ATP utilization.
(A) Catalytic potential plots for each of the enzyme modules as a function of the energy charge. Roman numerals indicate comparisons with the steady-state: (I) more enzyme in active form and higher energy charge; (II) more enzyme in active form and lower energy; (III) more enzyme in inactive form and lower energy charge; and (IV) more enzyme in inactive form and higher energy charge. The inset shows the concentration profile of FDP (see Fig D in S1 File for the detailed concentration profile). (B) Phase portraits displaying pairwise relationships between the active fractions of two kinases.

