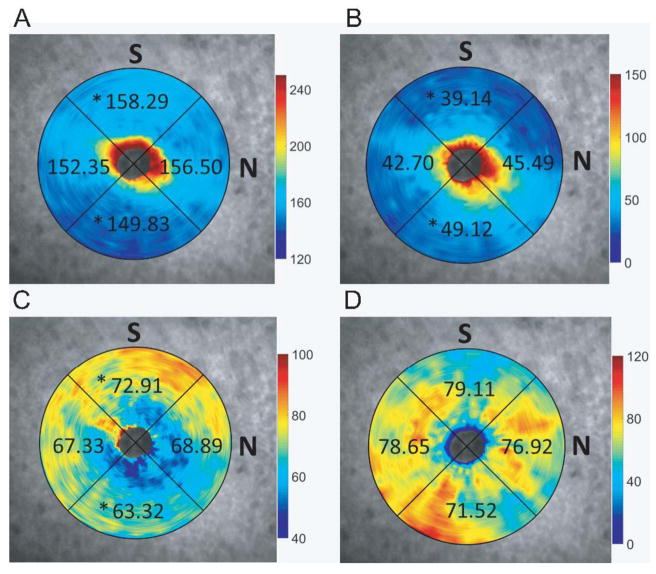
Figure 6.
Thickness maps derived from 24 line radial scans for A) total retina, B) ganglion cell/nerve fiber layer complex, C) outer retina, and D) choroid, overlaid on the corresponding scanning laser ophthalmoscope images; * indicates significant (p < 0.05) difference between superior and temporal thicknesses.

