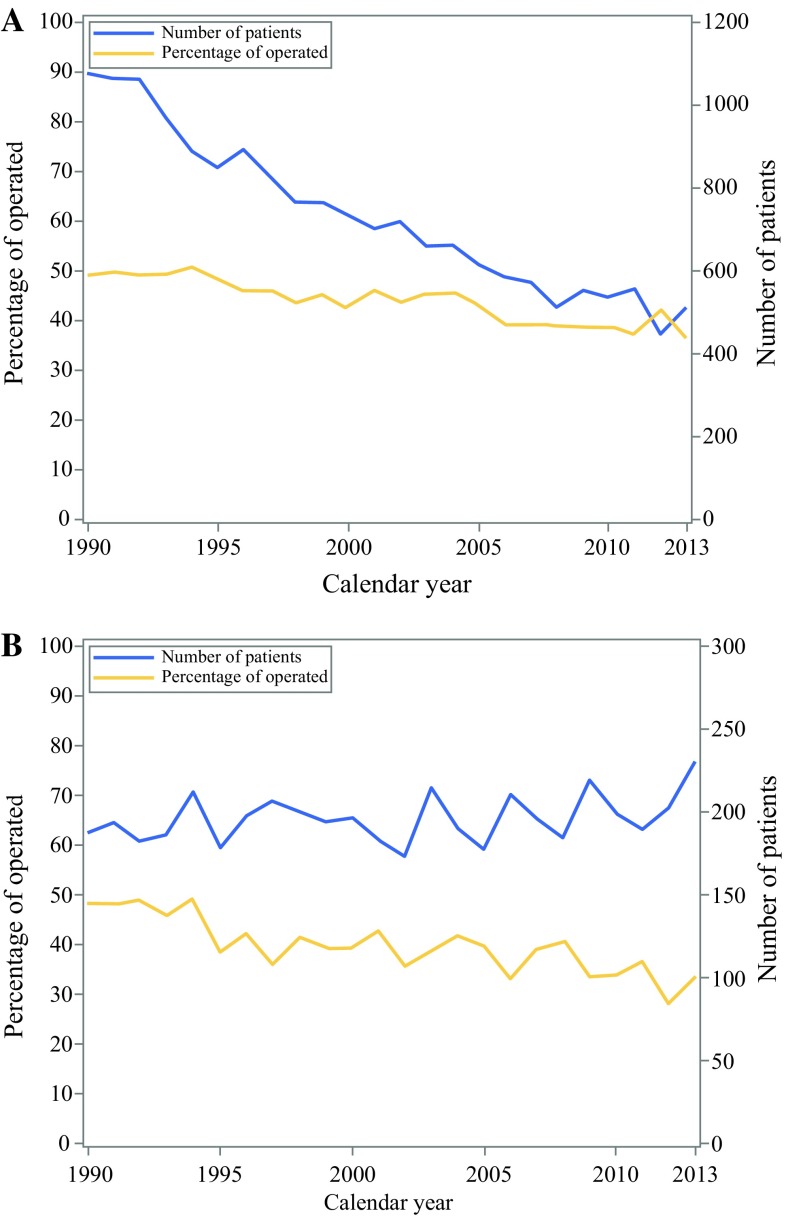
Fig. 1.
The graphs show number of gastric non-cardia adenocarcinoma (a) and gastric cardia adenocarcinoma (b) patients diagnosed in Sweden by year from 1990 to 2013 (with follow-up until 2017). The curves show the number of patients diagnosed with cancer (solid line) and proportion of patients undergoing surgery (dotted line)

