Figure 2.

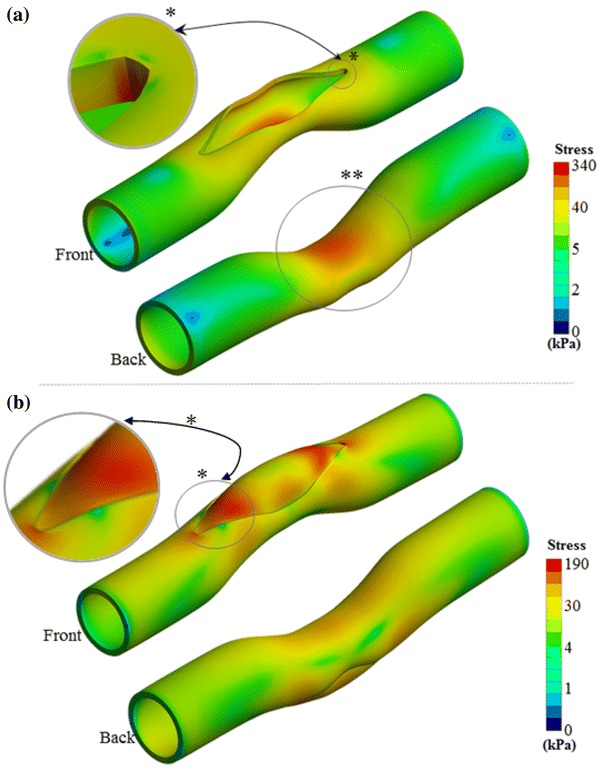
(a) Equivalent stress distribution on the artery during the opening of slit in surgery. * indicates the highest stressed region of the main pulmonary artery, which also observed symmetrically at the opposite side of the vessel. ** Highlights the relatively moderate stressed regions. (b) Equivalent stress distribution on the patch and artery after pressurizing to post-operative blood pressure level. *Shows the stress concentration regions on the patch and the artery. Stress gradient maps are shown in logarithmic scale to highlight the vessel and patch connection region’s stress contours in various colors.
