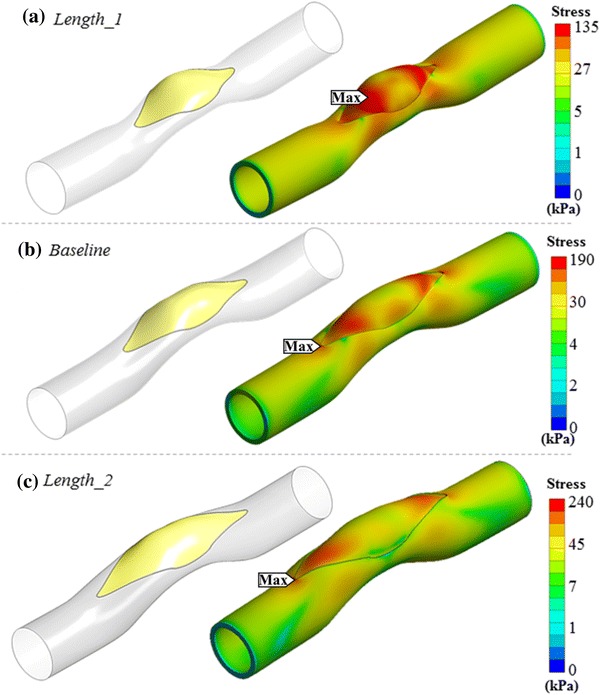
Figure 3.

Comparison of von-Misses stress distributions on patched models having different surgical incision lengths. Left column shows the generated patch for three different cases - right column shows equivalent stress distribution on patch and artery, considering post-operative blood pressure. (a) 20% shorter cut than stenosis length (Length_1). (b) Stenosis length same as the cut length (Baseline). (c) 20% longer than stenosis length (Length_2). Stress gradient maps are shown in logarithmic scale to highlight the vessel and patch connection region’s stress contours in various colors.
