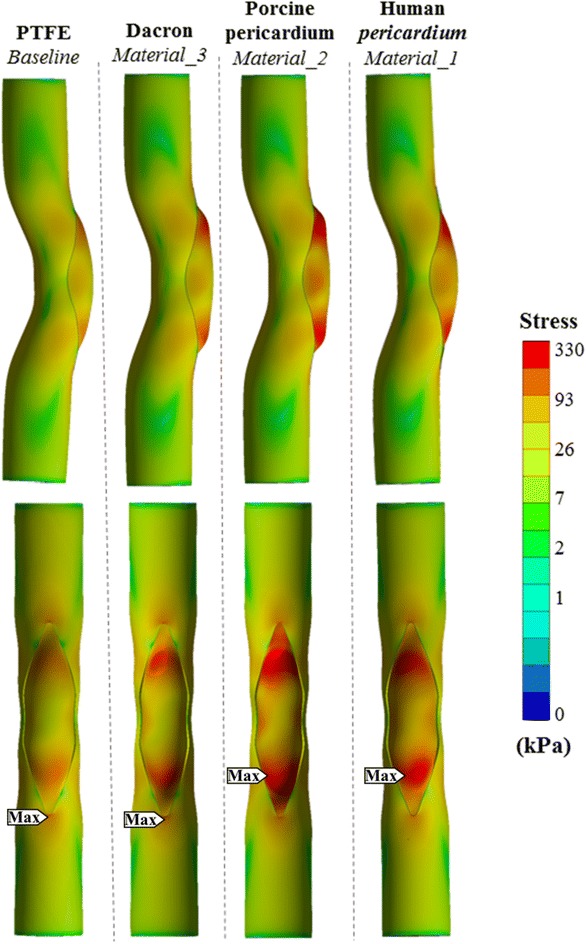
Figure 6.

Equivalent stress distributions after patch reconstruction corresponding to the acute post-operative state, for different patch materials. Top row shows the coronal view of parametric material models and bottom row shows the corresponding sagittal view. Stress gradient maps are shown in logarithmic scale to highlight the vessel and patch connection region’s stress contours in various colors.
