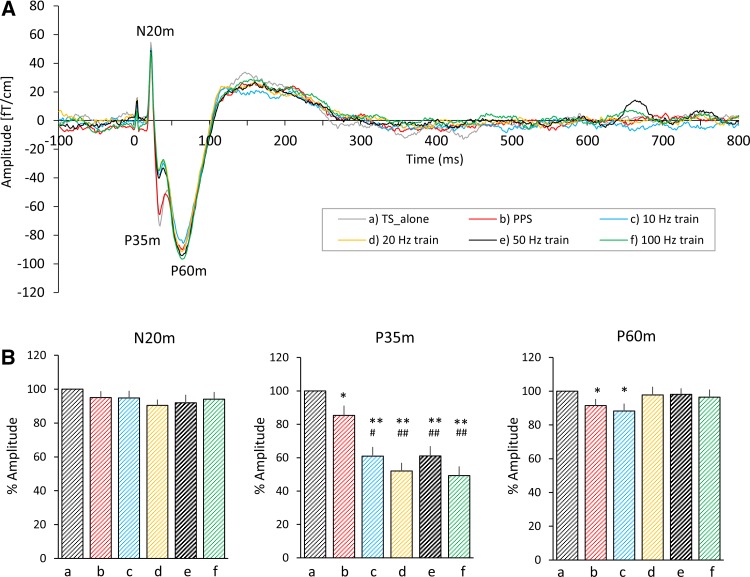
Fig. 2.
Grand averaged SEF waveforms and mean amplitudes of prominent SEF deflections. A The time-course of the grand averaged SEF waveforms from 100 ms before to 800 ms after a test stimulus elicited by all conditions are superimposed. The gray, red, blue, orange, black, and green lines indicate the SEF waveforms elicited by condition_a, _b, _c, _d, _e, and _f respectively. B The mean SEF amplitude at N20m, P35m, and P60m. a, b, c, d, e, and f under each bar graph indicate condition_a, _b, _c, _d, _e, and _f respectively. The error bars indicate the standard error of the mean (SEM). *p < 0.05 (vs. condition_a), **p < 0.01 (vs. condition_a), ##p < 0.01 (vs. condition_b)

