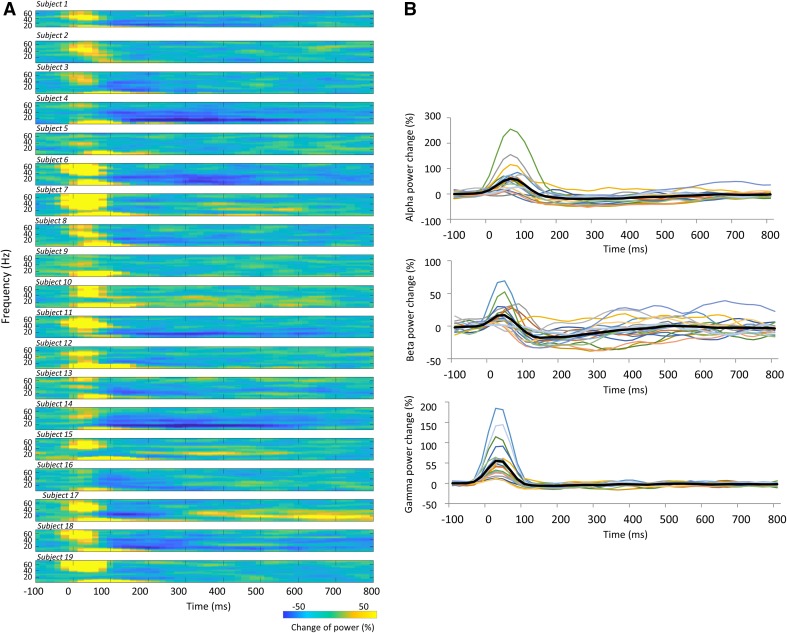
Fig. 3.
Time-course of frequency changes in power induced by condition_a (TS_alone). A Time frequency maps of signal power changes from 100 ms before to 800 ms after the test stimulation in all subjects. B Time-course of signal changes in power for each frequency from 100 ms before to 800 ms after the test stimulation band in all subjects

