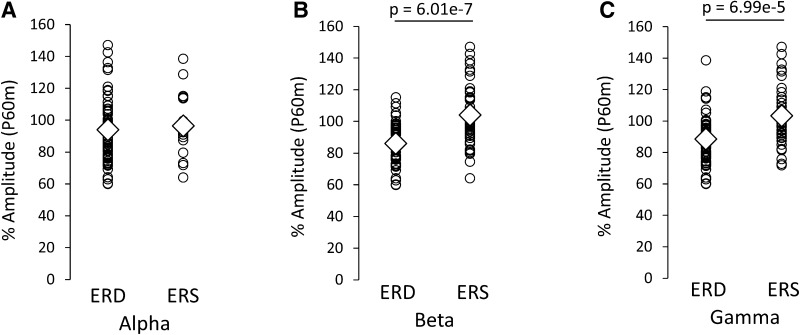
Fig. 8.
Comparison of the P60m_PPD ratio induced under all conditions with conditioning stimulation (condition_b, _c, _d, _e, and _f) between the ERS and ERD groups immediately before test stimulation, following each conditioning stimulation (condition_b, _c, _d, _e, and _f). A Alpha, B beta, and C gamma band changes in power. The PPD ratio at P60m was significantly smaller for the beta and gamma ERD groups than those for the beta and gamma ERS groups. There were no significant differences in the PPD ratio at P60m between the alpha ERD and alpha ERS groups

