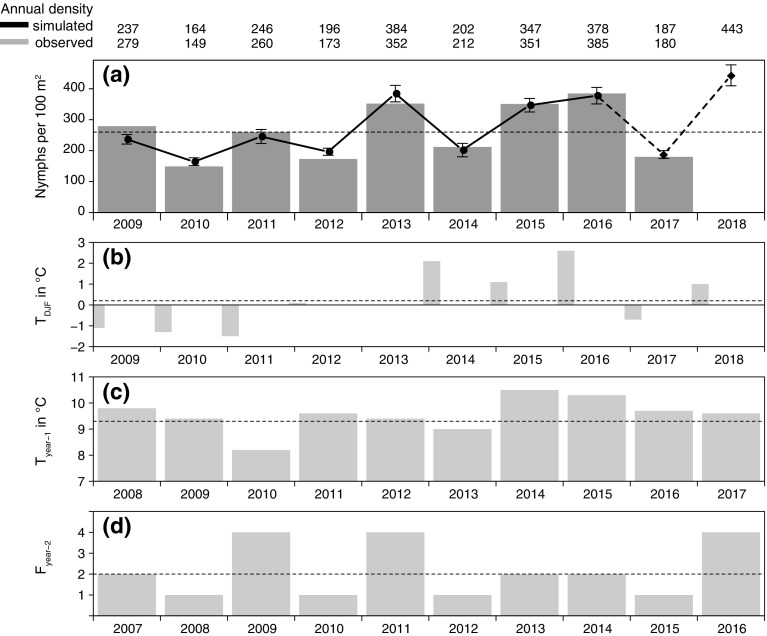
Fig. 1.
a Annual nymphal Ixodes ricinus density in Haselmühl (Germany) observed (grey bars) versus simulated (points) between 2009–2017 and forecasted for 2018 (diamond). The associated standard error is given. The explanatory variables b mean winter temperature , c mean annual temperature of the previous year , and d the beech fructification index 2 years prior . The dotted lines indicate the 9-year mean between 2009–2017 for the nymphal tick density and the 30-year mean of 1988–2017 for explanatory variables, respectively

