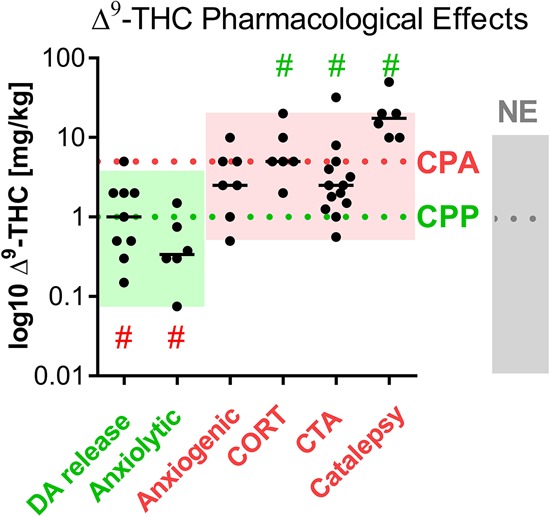
Figure 3.

Other dose-dependent appetitive (green) and aversive (red) effects of Δ9-THC. Results of individual experiments/ groups are plotted as black dots (median values as black lines); statistics: Wilcoxon signed rank test (one-sided question), P < 0.05 versus median of CPA and CPP, respectively. Median values of CPPs (1 mg/kg), CPAs (5 mg/kg), and NEs (1 mg/kg; cf. Fig. 2B) are incorporated as green, red, and gray dashed lines, respectively; dose ranges of CPPs, CPAs, and NEs are illustrated in the respective (yet fainter) colors. # (red) p < 0.05 versus median of CPA, # (green) p < 0.05 versus median of CPP (Wilcoxon signed test).
