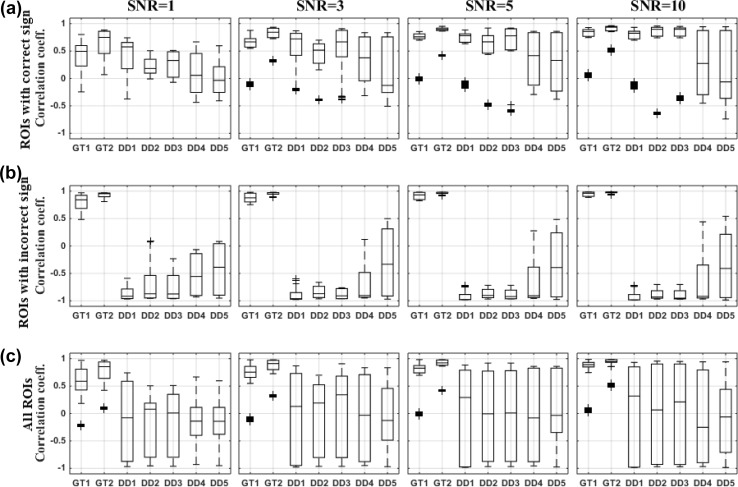
Fig. 3.
The correlation coefficient with corresponding ground truth time series for the dipole selection strategies at different levels of SNR. Box-and-Whisker plots across all regions and 100 noise realizations are shown. a ROIs with the correct sign of the dominant direction compared to the ground truth direction. b ROIs with an incorrect sign of the dominant direction compared to the ground truth direction. c Overall results

