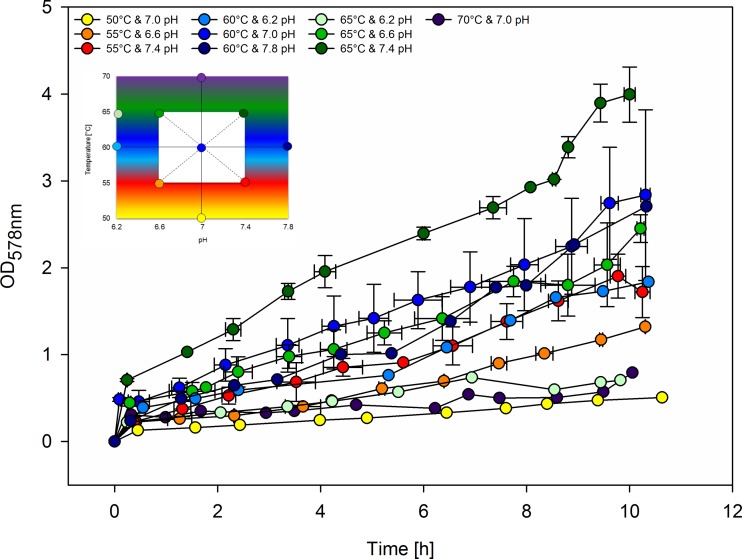
Fig. 2.
DoE raw data growth curves showing OD578nm values plotted as function of time. The DoE was based on a central composite design (figure in the upper left corner). Temperature and pH were systematically varied in a multivariate design space to determine the optimal cultivation temperature and pH. Experiments indicated with yellow (50 °C and 7.0 pH), light blue (60 °C and 6.2 pH), dark blue (60 °C and 7.8 pH), light green (65 °C and 6.2 pH), and violet (70 °C and 7.0 pH) dots were performed once. Experiments illustrated with orange (55 °C and 6.6 pH), red (55 °C and 7.4 pH), and dark green (65 °C and 7.4 pH) dots were performed twice. Experiments shown with green dots (65 °C and 6.6 pH) were performed in triplicates. The center point (blue dot in the middle of the white box) was examined in octuplicates. The colors of the dots of the figure in the upper left corner correspond to the growth curves. The different colors represent different cultivation conditions

