
Figure 2.
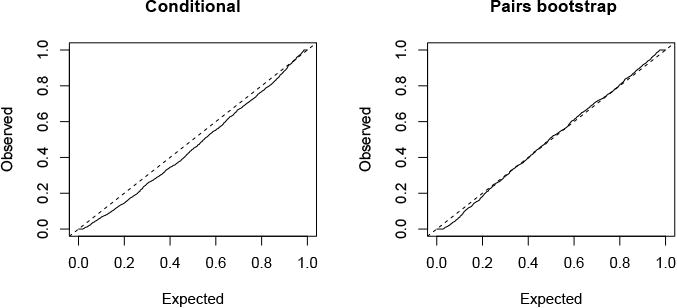
P-values for the lasso in the Gaussian setting: n = 200, p = 50, 20 strong signals. Predictors have pairwise correlation of 0.3 and variance of the errors depends on non-signal variables. Shown are the quantile-quantile plots for the non-signal variables in realizations for which the lasso has successfully screened (captured all of the signal variables). We see that the conditional analysis yields anti-conservative p-values while the pairs bootstrap gives p-values closer to uniform.