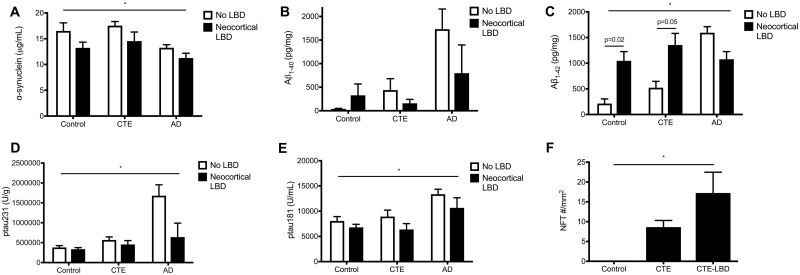
FIGURE 3.
Comparison of neurodegenerative protein density between pathological groups. Between participants with neocortical LBD and without LBD: (A) α-synuclein levels varied significantly between pathological groups (control, CTE, or AD; p = 0.025) and by the presence of neocortical LBD (p = 0.018, ANOVA). (B) Aβ1-40 levels were not significantly different by pathological group or neocortical LBD. (C) Aβ1-42 levels varied significantly by pathology (p = 0.009) and by the presence of neocortical LBD (p = 0.040, ANOVA). Multiple comparison testing (Bonferroni) showed significantly increased Aβ1-42 in neocortical LBD compared to participants without LBD for both controls (p = 0.02) and CTE (p = 0.05). (D) Levels of pTau231 were different between pathological groups with increased levels in AD (p = 0.032) but did not differ with LBD. (E) Levels of pTau181 (U/mL) were different between pathological groups with increased levels in AD (p = 0.041) but did not differ with LBD. (F) The density of neurofibrillary tangles (NFT) by AT8 immunostaining was increased in CTE and further increased in CTE with neocortical LBD compared to controls (p = 0.038, ANOVA).

