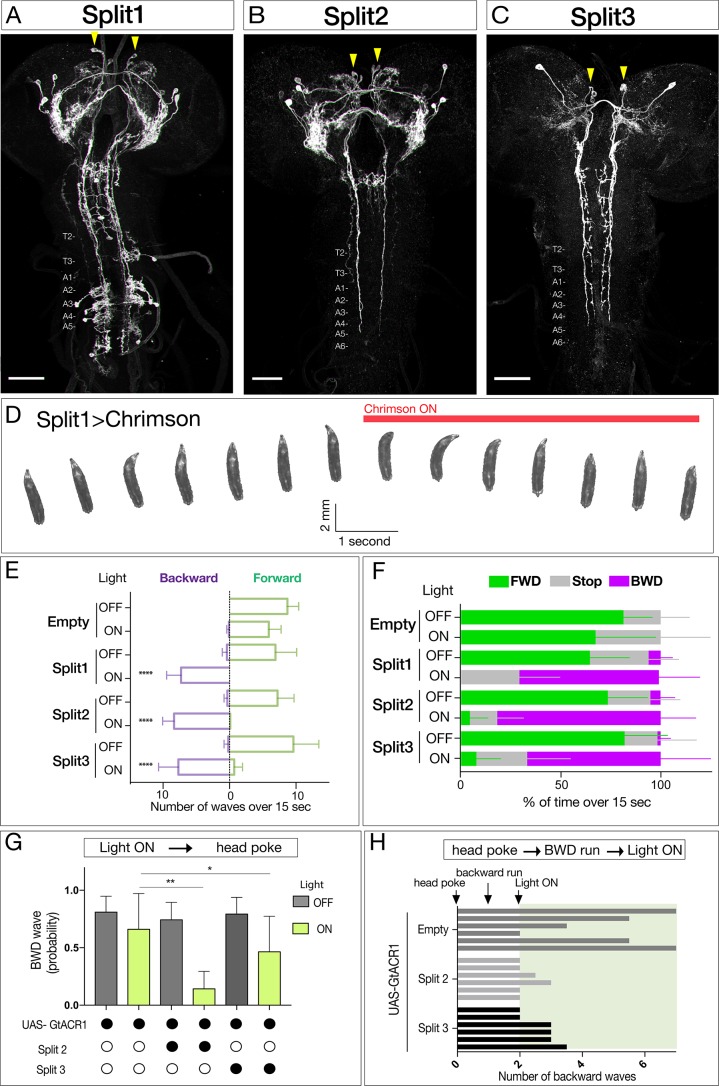
Figure 1. Neurons sufficient to induce backward larval locomotion.
(A–C) Split1-Split3 lines driving expression of membrane localized Venus in the third instar CNS. Corazonin (not shown) labels a single neuron in segments T2-A6, and was used to identify VNC segment identity. The only neurons potentially common to all three lines are a pair of bilateral ventral, anterior, medial neurons (arrowheads). Maximum intensity projection of entire CNS shown. Anterior, up; scale bars, 50 μm. Genotypes: R49F02-Gal4AD R53F07-Gal4DBD UAS-Chrimson:mVenus (Split1); R49F02-Gal4AD R53F07-Gal4DBD tsh-lexA lexAop-killer zipper UAS-Chrimson:mVenus (Split2); ss01613-Gal4 UAS-Chrimson:mVenus (Split3). (D) Split1 activation induces backward locomotion. Genotype: R49F02-Gal4AD R53F07-Gal4DBD UAS-Chrimson:mVenus. (E) Split1, Split2, or Split3 activation induces backward locomotion. Number of backward or forward waves in third instar larvae over 15 s with or without Chrimson activation. N = 10 for all genotypes. Genotypes: pBD-Gal4 UAS-Chrimson:mVenus (Empty) and see A-C above for Split1-3 genotypes. (F) Split1, Split2, or Split3 activation induces backward locomotion. Percentage of time performing forward locomotion (green), backward locomotion (magenta) or paused (grey) in third instar larvae over 15 s with or without Chrimson activation. N = 5 for all genotypes. Genotypes, see A-C. (G) Split2 or Split3 silencing reduces initiation of backward locomotion. Backward waves induced by a noxious head poke, with or without active GtACR1. Genotypes: pBD-Gal4 UAS-GtACR1:mVenus (first two bars, n = 20), R49F02-Gal4AD R53F07-Gal4DBD tsh-lexA lexAop-killer zipper UAS-GtACR1:mVenus (middle two bars, n = 8), ss01613-Gal4 UAS-GtACR1:mVenus (last two bars, n = 25). (H) Split2 or Split3 neuron silencing stops ongoing backward locomotion. After each larva initiated a backward run (two backward waves), light was used to activate GtACR1 or a no Gal4 control, and the number of backward waves was counted. n = 6 for both groups; each bar represents the average of two trials for the same larva. See G for genotypes.

