
Figure 3. Discriminator base predominantly determines the fate of the substrate.
Deacylation of (a) Gly-tRNAGly and (b) Gly-tRNAGly(U73A) by EcDTD in the presence or absence of EF-Tu (* indicates the data points are connected through line). Deacylation of (c) Gly-(Mm)tRNAGly and (d) Gly-(Mm)tRNAAla by various concentrations of MmDTD. Deacylation of (e) Gly-tRNAGly and (f) Gly-tRNAGly(U73A) by various concentrations of MmDTD. Lines indicate exponential decay fit and error bars represent one standard deviation from the mean of at least three independent readings.
Figure 3—source data 1. Biochemical data for EF-Tu protection assays and MmDTD deacylations.
elife-38232-fig3-data1.xlsx (30.2KB, xlsx)
DOI: 10.7554/eLife.38232.010

Figure 3—figure supplement 1. Northern blotting showing PfDTD overexpression using IPTG leads to depletion of Gly-tRNAGly while the inactive mutant of PfDTD (A112F) has no effect.
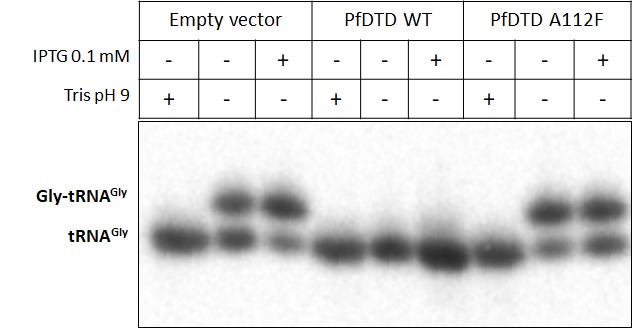
Tris pH nine is used as deacylation control.