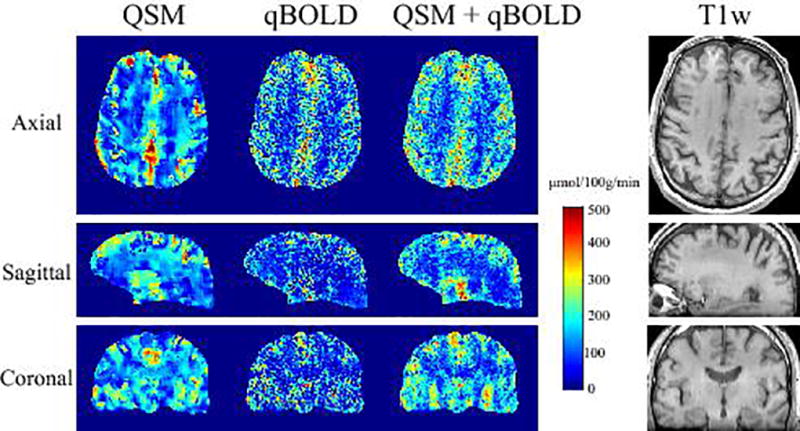
Figure 2.

CMRO2 map in axial, sagittal, and coronal sections from a subject reconstructed using QSM, qBOLD, and QSM+qBOLD methods. The corresponding T1-weighted anatomical images are shown on the right. QSM+qBOLD shows higher GM/WM contrast than QSM or qBOLD.
