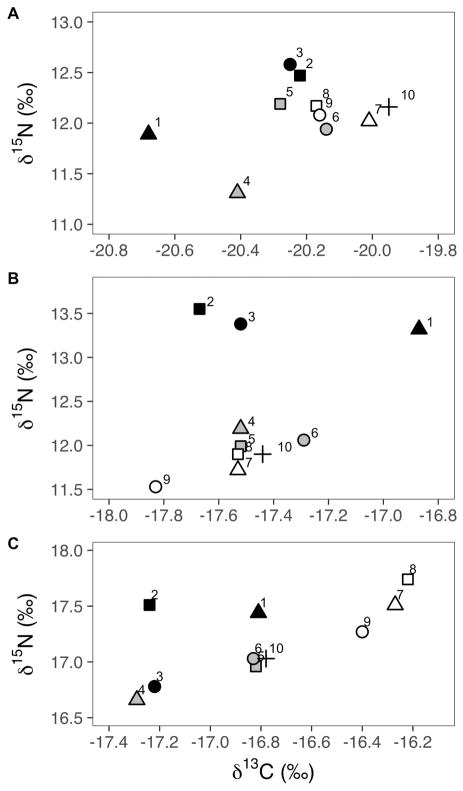
Figure 3.
Bi-plot showing carbon and nitrogen delta values from each piece of tissue from the fin (A), humpback (B), and sperm (C) whale samples that were sub-sampled into 10 pieces (Figure 1). Layers are shaded the same with outer layer = black, middle layer = grey, and inner layer = white. Cores are indicated with shapes, from left to right = triangles, squares, and circles. Sample 10, the full sample, is shown in with a “+” symbol. Note differences in scale of x-axes.

