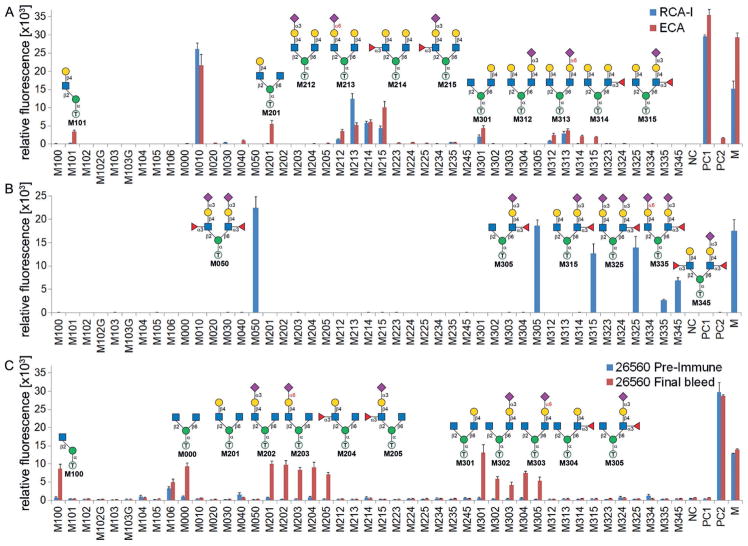
Figure 5.
Microarray analysis and evaluation of binding to spotted O-mannosyl glycans against Ricinus communis lectin I and Erythrina crystagalli lectin (A), anti-CD15s antibody (B), and core M2 polyclonal rabbit sera 26560 (C). The x axis shows the glycans, and the y axis shows the relative fluorescence. Readout by Cy3-streptavidin (A), goat anti-mouse IgG–Alexa Fluor 647 conjugate (B), and goat anti-rabbit IgG–Alexa Fluor 647 conjugate (C). NC =printing buffer, PC1 =biotin-PEG2-amine, PC2 =rabbit IgG, M =human IgG–Cy3 conjugate and human IgG–Alexa647 conjugate.

